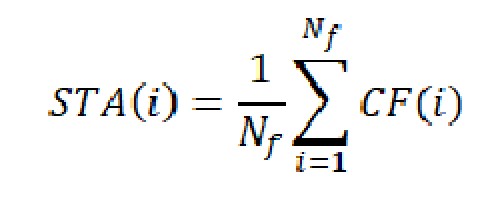
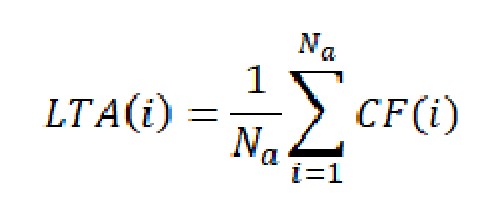
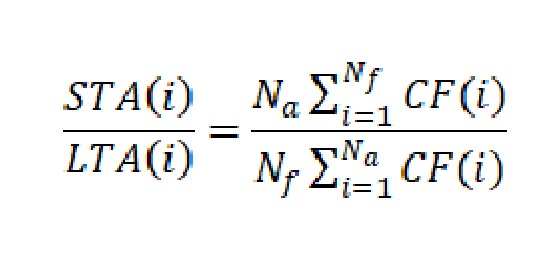
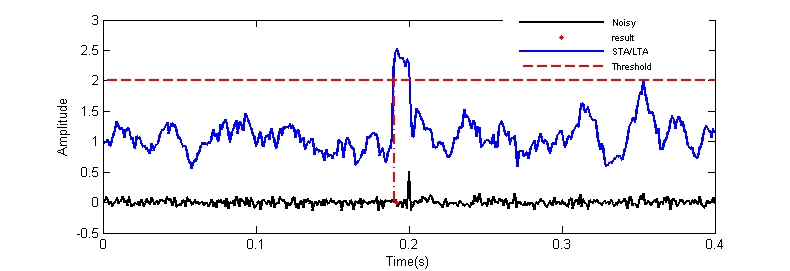
STA/LTA
- 长视窗短时窗算法
理论基础
代码实现
#include <bits/stdc++.h>
using namespace std;

struct SegyReelHdrStruct
{
    char comment[3200];
    long int jobid;
    long int lino;
    long int reno;
    short int ntrpr;
    short int nart;
    short int hdt;
    short int dto;
    short int hns;
    short int nso;
    short int format;
    short int fold; /* CDP fold expected per CDP ensemble */
    short int tsort;
    short int vscode;
    short int hsfs;        /* sweep frequency at start */
    short int hsfe;        /* sweep frequency at end */
    short int hslen;       /* sweep length (ms) */
    short int hstyp;
    short int schn;        /* trace number of sweep channel */
    short int hstas;
    short int hstae;
    short int htatyp;
    short int hcorr;       /* correlated data traces code:1 = no 2 = yes */
    short int bgrcv;       /* binary gain recovered code: 1 = yes 2 = no */
    short int rcvm;
    short int mfeet;       /* measurement system code: 1 = meters 2 = feet */
    short int polyt;
    short int vpol;
    short int hunass[170]; /* unassigned */
};
struct SegyTraceHdrStruct
{
    long int tracl; /* trace sequence number within line */
    long int tracr; /* trace sequence number within reel */
    long int fldr;  /* field record number */
    long int tracf; /* trace number within field record */
    long int ep;    /* energy source point number */
    long int cdp;   /* CDP ensemble number */
    long int cdpt;  /* trace number within CDP ensemble */
    short int trid;
    short int nvs;
    short int nhs;
    short int duse;  /* data use: 1 = production 2 = test */
    long int offset;
    long int gelev;
    long int selev;
    long int sdepth; /* source depth below surface (positive) */
    long int gdel;   /* datum elevation at receiver group */
    long int sdel;   /* datum elevation at source */
    long int swdep;  /* water depth at source */
    long int gwdep;  /* water depth at receiver group */
    short int scalel;
    short int scalco;
    long int sx; /* X source coordinate */
    long int sy; /* Y source coordinate */
    long int gx; /* X group coordinate */
    long int gy; /* Y group coordinate */
    short int counit;
    short int wevel;  /* weathering velocity */
    short int swevel; /* subweathering velocity */
    short int sut;    /* uphole time at source */
    short int gut;    /* uphole time at receiver group */
    short int sstat;  /* source static correction */
    short int gstat;  /* group static correction */
    short int tstat;  /* total static applied */
    short int laga;
    short int lagb;
    short int delrt;
    short int muts;        /* mute time--start */
    short int mute;        /* mute time--end */
    unsigned short int ns; /* number of samples in this trace */
    unsigned short int dt; /* sample interval; in micro-seconds */
    short int gain;
    short int igc;  /* instrument gain constant */
    short int igi;  /* instrument early or initial gain */
    short int corr; /* correlated: 1 = no 2 = yes */
    short int sfs;  /* sweep frequency at start */
    short int sfe;  /* sweep frequency at end */
    short int slen; /* sweep length in ms */
    short int styp;
    short int stas;   /* sweep trace taper length at start in ms */
    short int stae;   /* sweep trace taper length at end in ms */
    short int tatyp;  /* taper type: 1=linear, 2=cos^2, 3=other */
    short int afilf;  /* alias filter frequency if used */
    short int afils;  /* alias filter slope */
    short int nofilf; /* notch filter frequency if used */
    short int nofils; /* notch filter slope */
    short int lcf;    /* low cut frequency if used */
    short int hcf;    /* high cut frequncy if used */
    short int lcs;    /* low cut slope */
    short int hcs;    /* high cut slope */
    short int year;   /* year data recorded */
    short int day;    /* day of year */
    short int hour;   /* hour of day (24 hour clock) */
    short int minute; /* minute of hour */
    short int sec;    /* second of minute */
    short int timbas; /* time basis code:1 = local 2 = GMT 3 = other */
    short int trwf;
    short int grnors; /* geophone group number of roll switch position one */
    short int grnofr;
    short int grnlof;
    short int gaps; /* gap size (total number of groups dropped) */
    short int otrav;
    short int unass[30]; /* unassigned -- for optional info */
};

int main()
{
    FILE *f1, *f2,*f3,*f4,*f5; //定义两个文件指针变量
    int i, l;
    char FileName[200]; //字符数组,存放文件名
    int Traces, Trace_length, Trace2read;
    float *TraceData;
    //printf("输入地震文件名[*.sgy]:");
    //scanf("%s",FileName);
    //当然上面两行,可用一个这样的语句代替:strcpy(FileName,"100.sgy");
    f1 = fopen("./1.sgy", "rb"); //打开文件,打开形式为:二进制读 rb
    if (f1 == NULL)              //判断打开了没有,不成功就返回吧。
    {
        printf("Cannot open input file!\n"); //显示信息
        exit(0);                             //退出
    }
    Trace2read = 430;   // 要读取哪一道,可以键盘输入,为方便在这就给定了,设为第430道
    Trace_length = 800; //一个地震道里面 数据的个数,可以从文件头获得,这里先拿来用了
    Traces = 631;       //该文件地震道的个数,也可以通过文件头里面的信息设法获得,也是先拿来用
    l = 3600L + (240 + Trace_length * 4L) * (Trace2read) + 240;

    fseek(f1, l, 0); //定位到那个地震道的 数据的 开始位置
    TraceData = new float[Trace_length];

    fread(TraceData, 4L * Trace_length, 1, f1);

    fclose(f1);

    f2 = fopen("raw.txt", "w");
    for (i = 0; i < Trace_length; i++)
    {
        fprintf(f2, "%f \n", TraceData[i]);
    }
    fclose(f2);


    f3 = fopen("noisy.txt","w+");
    float a;
    for (i = 0; i < Trace_length; i++)
    {
        a = (rand()/(float)(RAND_MAX/2.0e+37))-1.0e+37;
        TraceData[i]+=a;
        fprintf(f3, "%f \n", TraceData[i]);
        printf("%lf \n", TraceData[i]);
    }
    fclose(f3);

    f4=fopen("long.txt","w+");
    for(i = 0; i < Trace_length; i++){
        float fa=TraceData[i];
        for(int j=1;j<=7;j++){
            fa=fa+TraceData[i+j];
        }
        fa=fa/8;
        fprintf(f4, "%f \n", fa);
    }
    fclose(f4);

    f5=fopen("short.txt","w+");
    for(i = 0; i < Trace_length; i++){
        float fa=TraceData[i];
        for(int j=1;j<=2;j++){
            fa=fa+TraceData[i+j];
        }
        fa=fa/3;
        fprintf(f5, "%f \n", fa);
    }
    fclose(f5);

    delete TraceData;
    return 0;
}
- 绘图
import matplotlib.pyplot as plt
import string

fo1 = open("C:\\Users\\13994\\Documents\\vscode\\c++\\noisy.txt", "r")
fo2 = open("C:\\Users\\13994\\Documents\\vscode\\c++\\long.txt", "r")
fo3 = open("C:\\Users\\13994\\Documents\\vscode\\c++\\short.txt", "r")
str1 = fo1.readlines()
str2 = fo2.readlines()
str3 = fo3.readlines()
cnt = 1
yl1 = [1.0]
yl2 = [1.0]
yl3 = [1.0]
yl4 = []
xl = [1]
for eachline in str1:
    ct1 = float(eachline)
    yl1.append(ct1)
    xl.append(cnt+1)
    cnt = cnt+1

cnt=1
for eachline in str2:
    ct1 = float(eachline)
    yl2.append(ct1)

cnt=1
for eachline in str3:
    ct1 = float(eachline)
    yl3.append(ct1)

for i in range(len(xl)):
    yl4.append(yl3[i]/yl2[i])

print(yl4)
fo1.close()
fo2.close()
fo3.close()
plt.plot(xl,yl1,label='noisy',c='black')
plt.plot(xl,yl2,label='LTA',c='blue')
plt.plot(xl,yl3,label='STA',c='red')
# plt.plot(xl,yl4,label='STA/LTA',c='green')
plt.xlabel('time(ms)')
plt.ylabel('Aplitude')
plt.title('STA && LTA')
plt.legend()
plt.show()
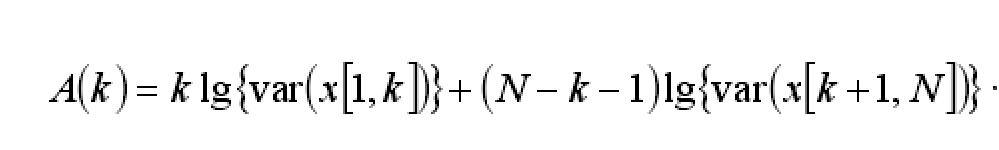
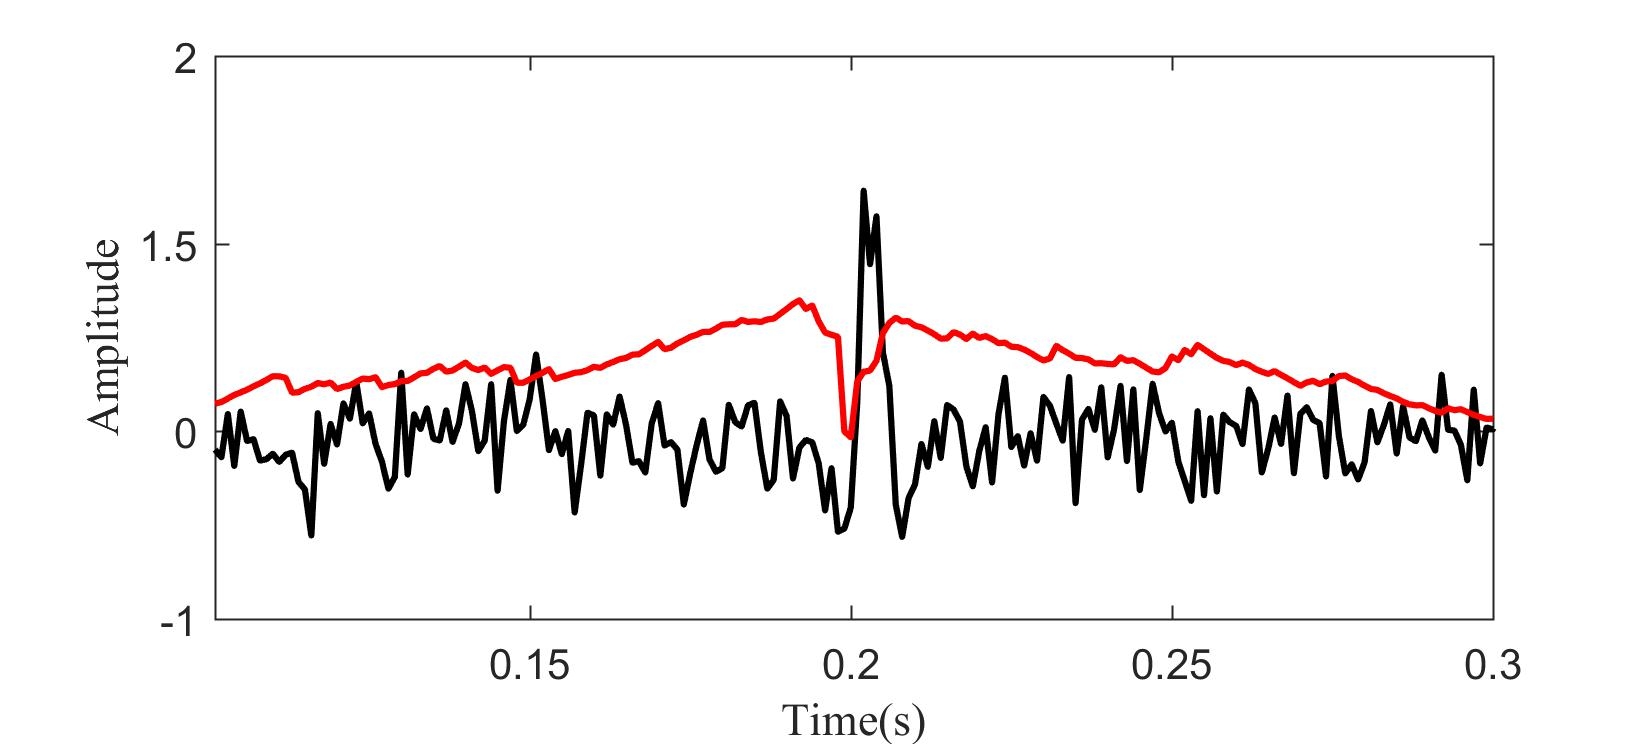
AIC算法
理论基础
代码实现
#include <bits/stdc++.h>
using namespace std;

struct Data{
    double x;
    double y;
    double z;
    double ak;

};
double var1(double Mx,int start,int end,double x){
    double ans=0;
    for(int i=start;i<=end;i++){
        ans+=pow((x-Mx),2);
    }
    return ans;
}
int main(){
    Data data1[15010];

    // 开始读取
    ifstream in("outxyz.txt");
    string filename;
    string line;
    int cnt=0;
    double tmp;
    if(in){
        while (getline (in, line)){
            cnt++;
            stringstream ss;
            ss << line;
            ss >> tmp;
            if(cnt%3==1){
                tmp=tmp*10000;
                data1[cnt/3].x=tmp;
            }else if(cnt%3==2){
                tmp=tmp*10000;
                data1[cnt/3].y=tmp;
            }else{
                tmp=tmp*10000;
                data1[cnt/3].z=tmp;
            }
        }
    }
    else{  cout <<"no such file" << endl;  }
    // 读取结束

    //AIC算法
    double Mx=0,My=0,Mz=0;
    for(int i=0;i<=14999;i++){
        Mx+=data1[i].x;
    }
    Mx=Mx/15000;
    for(int i=0;i<=14999;i++){
        double tmp3=0;
        tmp3+=(i+1)*log10(var1(Mx,1,i+1,data1[i].x));
        tmp3+=(15000-i-2)*log10(var1(Mx,i+2,150000,data1[i].x));
        data1[i].ak=tmp3;
    }

    //输出结果
    FILE *f1;
    f1=fopen("aicout.txt","w");
    for(int i=0;i<=14999;i++){
        fprintf(f1,"%llf\n",data1[i].ak);
    }
    fclose(f1);
    //输出结束
    return 0;
}
- 绘图
import matplotlib.pyplot as plt
import string
fo1=open("C:\\Users\\13994\\Documents\\vscode\\c++\\aicout.txt", "r")
fo2=open("C:\\Users\\13994\\Documents\\vscode\\c++\\outxyz.txt", "r")

cnt=1
yl1 = [0] #aic曲线
yl2 = [0]
xl = [1]

# 读取aic输出数据
str1 = fo1.readlines()
for eachline in str1:
    ct1 = float(eachline)
    ct1=ct1/400000
    ct1=ct1+0.2
    yl1.append(ct1)
    xl.append(cnt+1)
    cnt = cnt+1

# 读取原数据s
cnt=0
str2 = fo2.readlines()
for eachline in str2:
    ct1 = float(eachline)
    cnt=cnt+1
    if(cnt%3==1):
        ct1=ct1*10000
        yl2.append(ct1)
        #print(ct1)

fo1.close()
fo2.close()

plt.plot(xl,yl1,label='aic',c='red')
plt.plot(xl,yl2,label='raw',c='black')
plt.xlabel('time(ms)')
plt.ylabel('Aplitude')
plt.title('Meada-AIC')
plt.legend()
plt.show()
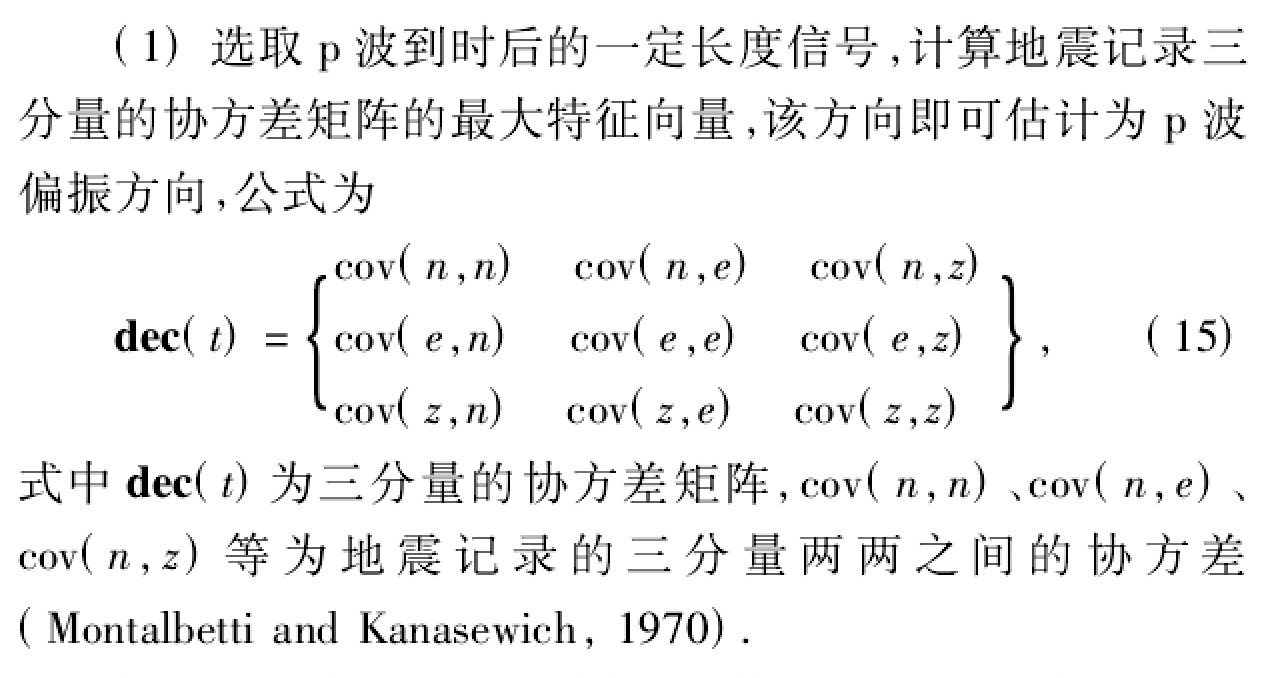
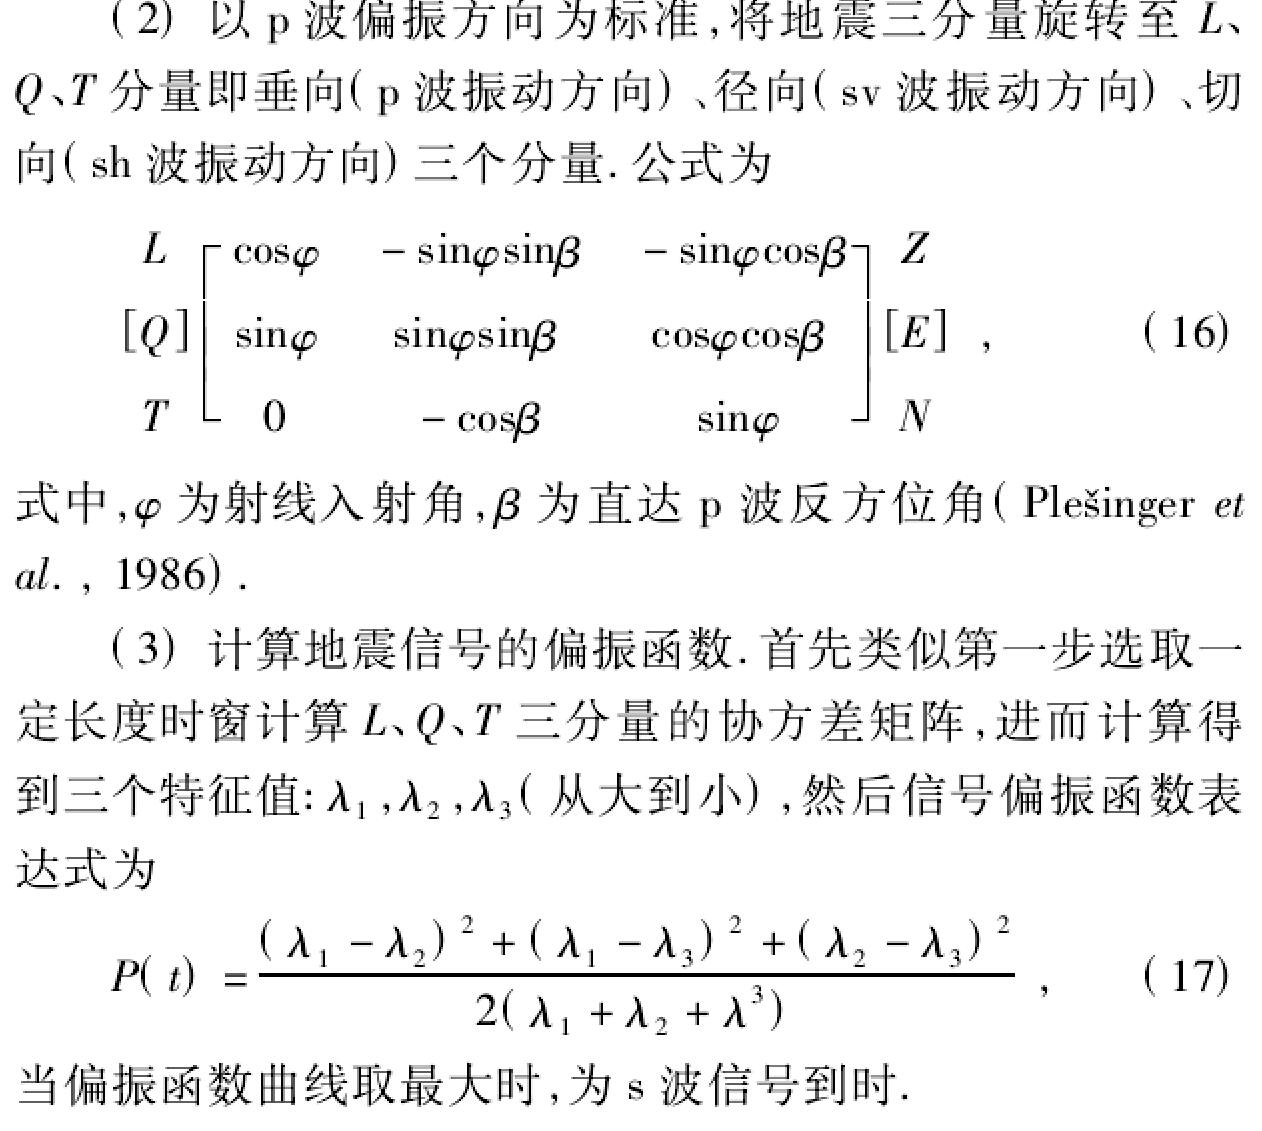
偏振算法
理论基础
代码实现
#include <bits/stdc++.h>
using namespace std;

void multiple(double**A,double *V,int dim_x,int dim_y);
double max(double *V,int dim);
void div_matrix(double *V,int dim,double m);

struct Data{
    double x;
    double y;
    double z;
    double r1,r2,r3;
    double T;
};
double tmp1[3];

void multiple(double**A,double *V,int dim_x,int dim_y){
    double *tmp = (double *)malloc(sizeof(double)*dim_y);
    for(int i=0;i<dim_y;i++)
        tmp[i] = 0;

    for(int i=0;i<dim_x;i++)
        for(int j=0;j<dim_y;j++)
            tmp[i] += A[i][j]*V[j];

    for(int i=0;i<dim_y;i++)
        V[i] = tmp[i];
    free(tmp);
}

double max(double *V,int dim){
    double tmp = V[0];
    for(int i=1;i<dim;i++)
            if(fabs(V[i]) > fabs(tmp))
                tmp = V[i];
    return tmp;
}

void div_matrix(double *V,int dim,double m){
    for(int i=0;i<dim;i++)
        V[i] /= m;
}

void tezhengzhi(double M1,double M2,double M3,double M4,double M5,double M6,double M7,double M8,double M9){
    int dim_x=3,dim_y=3;
    double **A,*V;
    double miu0 = 0,miu1 = 10;/*just make sure to enter the loop*/
    A = (double **)malloc(sizeof(double *)*dim_x);
    V = (double *)malloc(sizeof(double)*dim_y);
    for(int i=0;i<dim_x;i++)
        A[i] = (double *)malloc(sizeof(double)*dim_y);

    for(int i=0;i<dim_y;i++)
        V[i] = 1;/*initialing a vector with any value*/

    A[0][0]=M1;A[0][1]=M2;A[0][2]=M3;
    A[1][0]=M4;A[1][1]=M5;A[1][2]=M6;
    A[2][0]=M7;A[2][1]=M8;A[2][2]=M9;
    while(fabs(miu1-miu0) >= 1E-17){//迭代计算精度
        multiple(A,V,dim_x,dim_y);
        miu0 = miu1;
        miu1 = max(V,dim_y);
        div_matrix(V,dim_y,miu1);

    }
    for(int i=0;i<dim_y;i++){//特征值输出到tmp1[N]
        tmp1[i]=V[i];
    }

    free(V);
    for(int i=0;i<dim_y;i++)
        free(A[i]);
    free(A);

}
int main(){
    Data data1[15100];

    // 开始读取
    ifstream in("outxyz.txt");
    string filename;
    string line;
    int cnt=0;
    double tmp;
    if(in){
        while (getline (in, line)){
            cnt++;
            stringstream ss;
            ss << line;
            ss >> tmp;
            if(cnt%3==1){
                data1[cnt/3].x=tmp;
            }else if(cnt%3==2){
                data1[cnt/3].y=tmp;
            }else{
                data1[cnt/3].z=tmp;
            }
        }
    }
    else{  cout <<"no such file" << endl;  }
    // 读取结束

    //偏振分析算法
    double Mx=0,My=0,Mz=0;
    for(int i=0;i<=14999;i++){
        Mx+=data1[i].x;
        My+=data1[i].y;
        Mz+=data1[i].z;
    }
    Mx=Mx/15000;
    My=My/15000;
    Mz=Mz/15000;
    for(int i=0;i<15000;i++){
        memset(tmp1,0x3f,sizeof(tmp1));
        double Am=0,Bm=0,Cm=0;
        double M1=0,M2=0,M3=0,M4=0,M5=0,M6=0,M7=0,M8=0,M9=0;
        for(int j=0;j<30;j++){
            Am=data1[i+j].x-Mx;
            Bm=data1[i+j].y-My;
            Cm=data1[i+j].z-Mz;
            M1+=Am*Am;
            M2+=Am*Bm;
            M3+=Am*Cm;
            M4+=Bm*Am;
            M5+=Bm*Bm;
            M6+=Bm*Cm;
            M7+=Cm*Am;
            M8+=Cm*Bm;
            M9+=Cm*Cm;
        }
        tezhengzhi(M1,M2,M3,M4,M5,M6,M7,M8,M9);
        sort(tmp1,tmp1+3);
        data1[i].r1=tmp1[2];
        data1[i].r2=tmp1[1];
        data1[i].r3=tmp1[0];
        data1[i].T=pow(1-(data1[i].r2/data1[i].r1),2)+pow(1-(data1[i].r3/data1[i].r1),2)+pow(1-((data1[i].r2-data1[i].r3)/data1[i].r1),2);
        data1[i].T=data1[i].T/(2*(1+(data1[i].r2/data1[i].r1)+(data1[i].r3/data1[i].r1)));
        printf("%llf",data1[i].T);
    }
    //计算结束


    //输出结果
    FILE *f1;
    f1=fopen("polarout.txt","w");
    for(int i=0;i<=14999;i++){
        fprintf(f1,"%llf\n",data1[i].T);
    }
    fclose(f1);
    //输出结束
    return 0;
}
- 绘图
import matplotlib.pyplot as plt
import string
fo1=open("C:\\Users\\13994\\Documents\\vscode\\c++\\polarout.txt", "r")
fo2=open("C:\\Users\\13994\\Documents\\vscode\\c++\\outxyz.txt", "r")

cnt=1
yl1 = [0] #aic曲线
yl2 = [0]
xl = [1]

# 读取分形维输出数据
str1 = fo1.readlines()
for eachline in str1:
    ct1 = float(eachline)
    ct1=ct1/100
#     ct1=ct1+1
    yl1.append(ct1)
    xl.append((cnt+1)*4)
    cnt = cnt+1

# 读取原数据s
cnt=0
str2 = fo2.readlines()
for eachline in str2:
    ct1 = float(eachline)
    cnt=cnt+1
    if(cnt%3==1):
        ct1=ct1*20000
        yl2.append(ct1)
        #print(ct1)

fo1.close()
fo2.close()

plt.plot(xl,yl1,label='polarization',c='red')
plt.plot(xl,yl2,label='raw',c='black')
plt.xlabel('time(ms)')
plt.ylabel('Aplitude')
plt.title('Polarization analysis')
plt.legend()
plt.show()
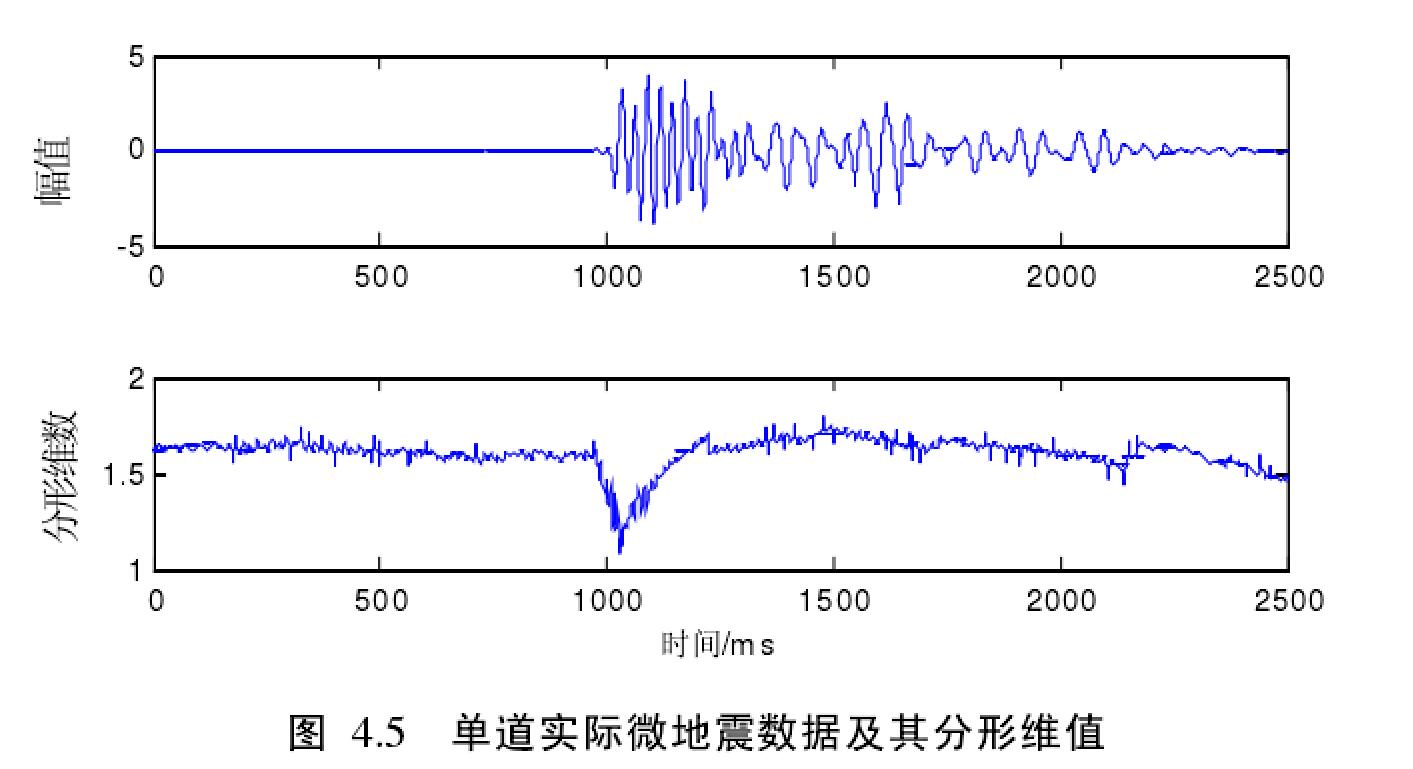
分形维算法
理论基础
代码实现
#include <bits/stdc++.h>
using namespace std;
#define N 150 //N为要拟合的数据的个数

float X[510];
float Y[510];
float K=0;               //拟合直线的斜率
float R=0;               //拟合直线的截距

float x_sum_average=0;   //数组 X[N] 个元素求和 并求平均值
float y_sum_average=0;   //数组 Y[N] 个元素求和 并求平均值
float x_square_sum=0;    //数组 X[N] 个个元素的平均值
float x_multiply_y=0;    //数组 X[N]和Y[N]对应元素的乘机

float Squre_sum(float c[N]) ;
float Sum_Average(float d[N]);
float X_Y_By(float m[N],float n[N]);
float Squre_sum(float c[N]);
float Line_Fit();

struct Data{
    double x;
    double y;
    double z;
    double ratio;
};


float Line_Fit(){
    x_sum_average= Sum_Average(X);
    y_sum_average= Sum_Average(Y);
    x_square_sum = Squre_sum(X);
    x_multiply_y = X_Y_By(X,Y);
    K = ( x_multiply_y - N * x_sum_average * y_sum_average)/(x_square_sum - N * x_sum_average*x_sum_average );
    R = y_sum_average - K * x_sum_average;
    return K;
}
float Sum_Average(float d[N]){
    unsigned int i=0;
    float z=0;
    for(i=0; i<N; i++)    {
        z = z + d[i];
    }
    z = z/N;
    return z;
}
float X_Y_By(float m[N],float n[N]){
    unsigned int i=0;
    float z=0;
    for(i=0; i<N; i++)
    {
        z = z + m[i]*n[i];
    }
    return z;
}
float Squre_sum(float c[N]){
    unsigned int i=0;
    float z=0;
    for(i=0; i<N; i++)   {
       z = z + c[i]*c[i];
    }
    return z;
}


int main(){
    Data data1[20000];

    // 开始读取
    ifstream in("outxyz.txt");
    string filename;
    string line;
    int cnt=0;
    double tmp;
    if(in){
        while (getline (in, line)){
            cnt++;
            stringstream ss;
            ss << line;
            ss >> tmp;
            if(cnt%3==1){
                tmp=tmp*10000;
                data1[cnt/3].x=tmp;
            }else if(cnt%3==2){
                tmp=tmp*10000;
                data1[cnt/3].y=tmp;
            }else{
                tmp=tmp*10000;
                data1[cnt/3].z=tmp;
            }
        }
    }
    else{  cout <<"no such file" << endl;  }
    // 读取结束

    // 分型计盒维数
    float K=0;
    float linelength=0,steplength=0;  //记录步长和曲线长度
    for(int i=0;i<=14999;i++){
        for(int len=1;len<=151;len++){
            double tmp4=0;
            tmp4=data1[i].x;
            for(int j=1;j<=len;j++){
                tmp4+=data1[i+j].x;
            }
            linelength=fabs((float)tmp4);
            steplength=fabs((float)len);
            Y[len-1]=log10(linelength);
            X[len-1]=log10(steplength);
        }
        K=Line_Fit();
        data1[i].ratio=(double)K;
    }
    // 算法结束

    // 输出
    FILE *f1;
    f1=fopen("ratioout.txt","w");
    for(int i=0;i<=14999;i++){
        fprintf(f1,"%llf\n",data1[i].ratio);
    }
    fclose(f1);
    // 输出结束
    return 1;
}
- 绘图
import matplotlib.pyplot as plt
import string
fo1=open("C:\\Users\\13994\\Documents\\vscode\\c++\\ratioout.txt", "r")
fo2=open("C:\\Users\\13994\\Documents\\vscode\\c++\\outxyz.txt", "r")

cnt=1
yl1 = [0] #aic曲线
yl2 = [0]
xl = [1]

# 读取分形维输出数据
str1 = fo1.readlines()
for eachline in str1:
    ct1 = float(eachline)
    #ct1=ct1/10
    ct1=ct1+1
    yl1.append(ct1)
    xl.append(cnt+1)
    cnt = cnt+1

# 读取原数据s
cnt=0
str2 = fo2.readlines()
for eachline in str2:
    ct1 = float(eachline)
    cnt=cnt+1
    if(cnt%3==1):
        ct1=ct1*20000
        yl2.append(ct1)
        #print(ct1)

fo1.close()
fo2.close()

plt.plot(xl,yl1,label='ratio',c='red')
plt.plot(xl,yl2,label='raw',c='black')
plt.xlabel('time(ms)')
plt.ylabel('Aplitude')
plt.title('Fractal dimension calculation method')
plt.legend()
plt.show()